Article • 10 min read
17 help desk and service desk metrics to measure support performance
Track these 17 essential help and service desk metrics and KPIs to understand team performance, spot bottlenecks, and optimize every step of your support workflow.


Mozhdeh Rastegar-Panah
Senior Director, Product Marketing
Last updated December 23, 2025


People have grown to expect instant answers from support teams, or at least the freedom to solve issues independently through self-service portals or knowledge bases. To meet these fast-evolving customer and employee demands, companies need to track the right help desk metrics and service desk metrics.
These data points reveal how quickly, effectively, and consistently your IT and customer support teams are performing. But with so many help desk and service desk metrics available, it’s hard to narrow them down. The key is to focus on those measuring productivity, agent performance, and customer and financial impacts.
With these 17 key help desk and service desk metrics, you can discover valuable insights to help enhance efficiency and boost customer and employee satisfaction.
More in this guide:
- What are help desk metrics and kpis?
- What are service desk performance metrics?
- 4 Types of help desk metrics
- 17 Help desk metrics & KPIs
- Best practices for improving your help and service desk metrics
- 6 benefits of tracking help desk metrics
- Getting started on help desk metrics and kpis: a brief step-by-step guide
- Frequently Asked Questions
What are help desk metrics and KPIs?
Help desk metrics and key performance indicators (KPIs) are data points that show in numbers how efficient support teams are in resolving issues and assisting customers. In short, help desk metrics measure activity (ticket volume, response times, etc.) while KPIs measure success (for example, a CSAT score above 90%).
What are service desk performance metrics?
Service desk performance metrics are performance indicators used to measure how effectively an organization’s IT team supports its employees. Service desk metrics are used to assess indicators like efficiency and responsiveness of the service provided by the service desk.
While help desks and service desks are not the same (the first targets customers and the latter targets employees), they’re often used interchangeably. Many enterprise help desk systems apply similar performance indicators to evaluate how efficiently internal IT teams support large-scale operations and employee productivity.
So, many metrics that are tracked for help desks can also be tracked to measure the success of a service desk.
4 types of help desk performance metrics
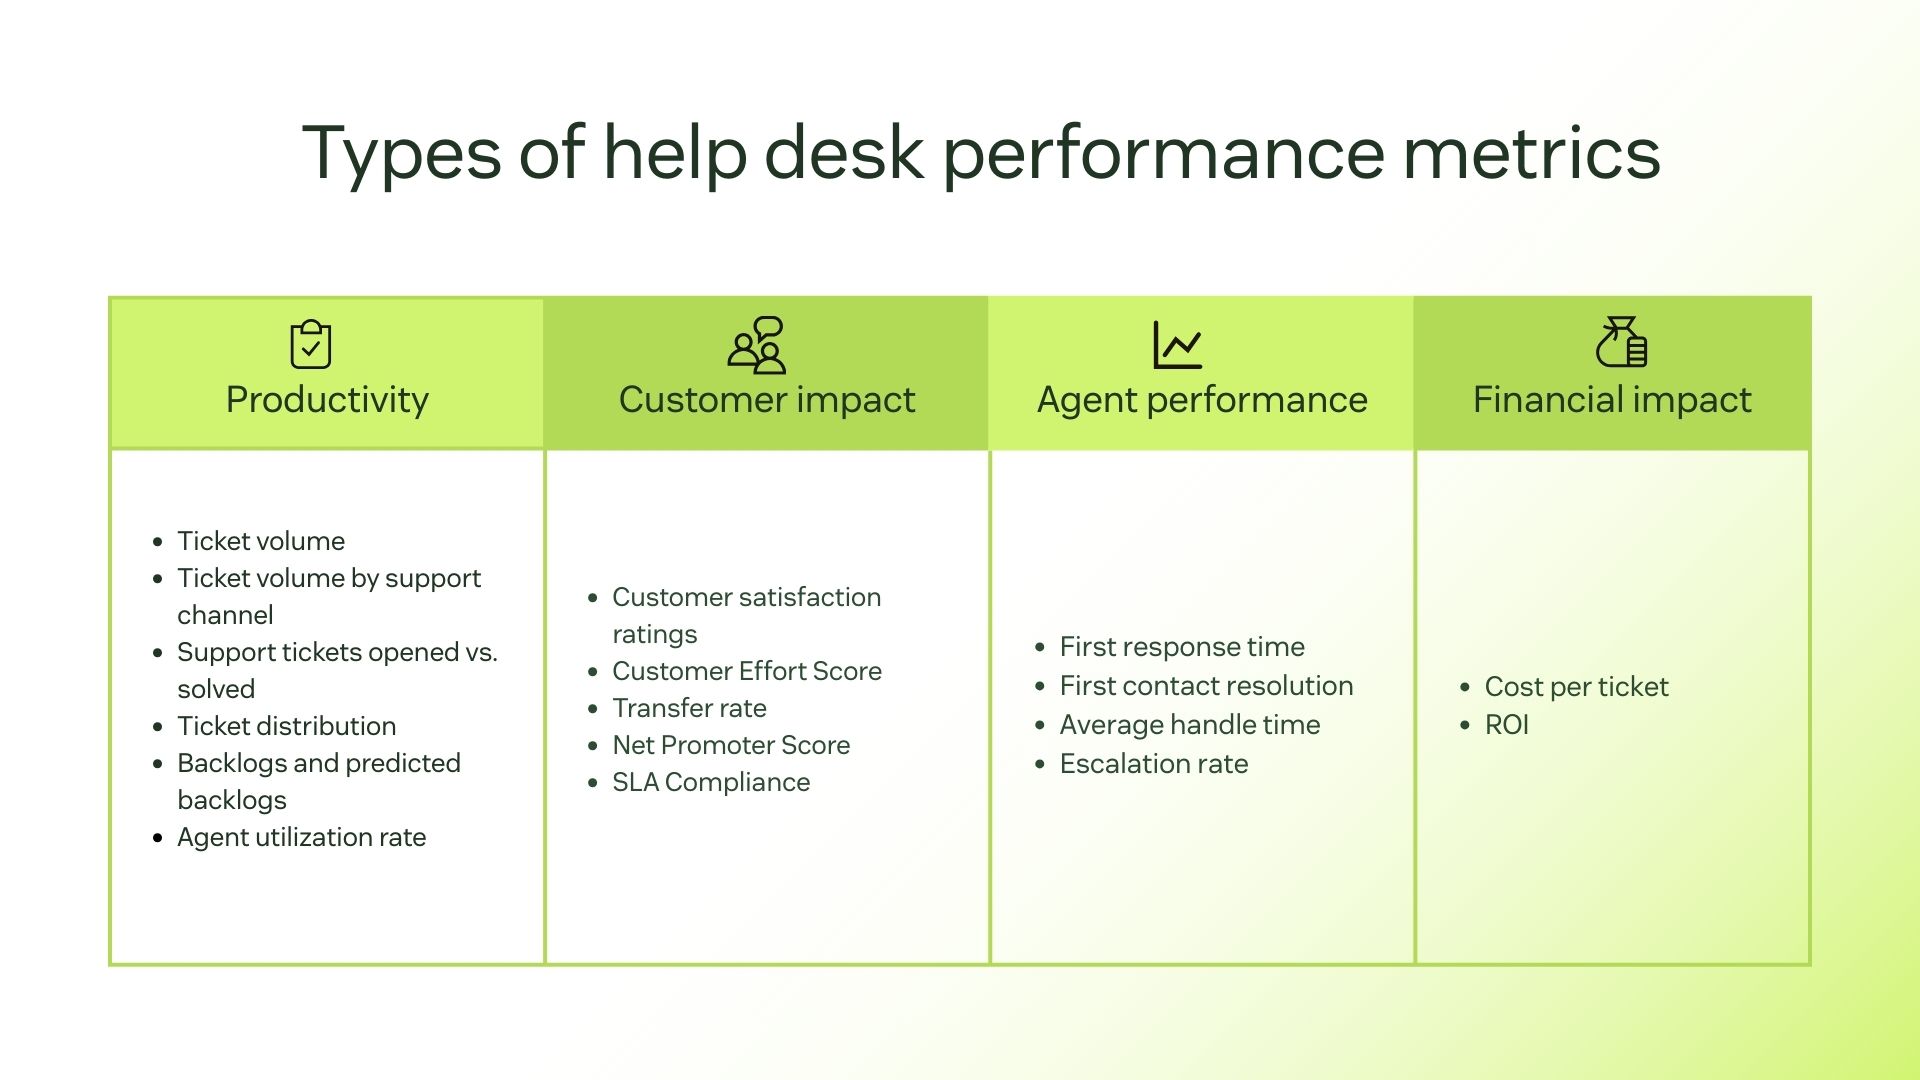
Not all metrics have the same importance to all companies. To truly understand how well your support team is performing, you should focus on the metrics that align the most with your goals.
To help you find the help desk metrics that truly matter, we’ve divided them into four key categories. Each type highlights a different aspect of performance. Let’s explore them.
1. Productivity metrics
Measure how help desk and service desk teams handle workload and time management. This is essential for identifying workflow, staffing, and speed bottlenecks.
- Ticket volume
- Ticket volume by support channel
- Support tickets opened vs. solved
- Ticket distribution
- Backlogs and predicted backlogs
- Agent utilization rate
2. Customer impact metrics
Measure customers’ sentiment after interacting with your support. Learning how customers feel helps you understand how to build long-lasting relationships and loyalty.
3. Agent performance metrics
Measure the skill level and performance of each individual agent to identify training needs and consistency improvements, and acknowledge top performers’ efforts.
4. Financial impact metrics
Measure the cost efficiency of your help desk operations to understand the balance between service quality and cost control.
17 help desk metrics and KPIs
1. Ticket volume
Type of metric: Productivity
Both your IT service management (ITSM) and customer service teams should monitor the volume of incoming service requests, aka support tickets. A ticket creation report in your customer support or help desk software should show you the ticket volume your ITSM or support team manages at any given time.
Once you get a sense of how many tickets your team can handle in a day, week, or month, this help and service desk metric will be incredibly important for staffing purposes.
Why it matters: Ticket volume metrics give you a clear picture of demand and workload, so you can spot patterns and plan staffing according to peak periods.
How to calculate it: To calculate ticket volume,count the total number of tickets created within a set time period (daily, weekly, or monthly).
2. Ticket volume by support channel
Type of metric: Productivity
Whether it’s customer service or internal help desk management, people want to be in charge of how they reach out to you. Your customers’ channel preferences may vary, so each channel can require different staffing and skills.
Tracking the ticket volume for each support channel is important for optimizing the efficiency of your support team and the quality of each resolution, as well as knowing where you may need to move, train, or hire staff.
Why it matters: Ticket volume by channel metrics help understand where customers prefer to engage. Knowing which channels have more volume enables efficient staffing and resource allocation.
How to calculate it: To calculate ticket volume by support channel, count the total number of tickets received through each support channel (email, chat, phone, social media) during a specific time period.
3. Support tickets opened vs. solved
Type of Metric: Productivity
In a healthy help or service desk, your tickets opened and tickets solved trend lines should be parallel. By looking at these metrics every week, you can make sure you’re keeping up with demand and identifying trends in ticket volume.
For example, if resolutions are consistently behind, you may need to add more staff or look at other ways to increase efficiency. Or, if you see a sudden spike in new tickets opened, that can alert you to a service delivery issue or other disruption that needs attention.
Why it matters: Comparing support tickets opened vs. solved shows whether your team is keeping pace with demand. It helps identify workload imbalances and efficiency gaps.
How to calculate it: To calculate support tickets opened vs. solved, countthe number of tickets opened and solved within the same timeframe. Reduce the number of tickets solved from the number of tickets opened.
4. Ticket distribution
Type of metric: Productivity
If you’re using customer service software, you can add category tags to your tickets to help you identify certain topics or products that result in more tickets than others. Additionally, a support manager needs to look at how support requests are distributed across different topic areas.
This can help you determine if there is any correlation between satisfaction scores and low first-time responses to support requests. Monitoring your distribution can alert you to a recurring problem with your product or service, which can illuminate where you might need to add or expand on existing knowledge base content.
Why it matters: Ticket distribution metrics are needed to identify issues or products that generate the most requests. These metrics help you spot recurring problems, improve self-service options (knowledge base and FAQs), and allocate agents correctly.
How to calculate it: To calculate ticket distribution,categorize all tickets by topic, issue type, or product. Then, calculate the percentage each category represents out of total tickets.
5. Backlogs and predicted backlogs
Type of metric: Productivity
Another key metric a service desk manager or ITSM help desk manager should consider is the ticket backlog in their support queue. If more requests are coming than can be handled every week, you’re building a backlog.
Providing a robust knowledge base or using automated help desk software are great ways to mitigate backlog issues. You can also encourage support agents to tackle ticket backlogs proactively. Your predicted backlog can help you learn from the past and prepare for the future.
Monitoring which teams or individuals are falling behind and the expected increase or decrease in ticket volume can help you plan and allocate resources accordingly.
Why it matters: Backlogs and predicted backlogs metrics help evaluate team capacity and spot workflow inefficiencies.
How to calculate it: To calculate backlogs, count the number of open tickets during a certain period and the number of resolved tickets in the same period. Then, subtract the tickets resolved from the total open tickets.
6. Agent utilization rate
Type of metric: Productivity
Your help and service desk employees are critical to the success of your support operation, so it’s important to track individual performance and agent utilization. Performance statistics can help you identify which support agents are top performers and illuminate opportunities for additional training.
Reviewing these metrics regularly also allows you to optimize your staffing allocation based on channels where agents perform well and where ticket volumes are high. Playing to each individual’s strengths can help improve agent productivity and provide better service to employees and customers.
Why it matters: Agent utilization rate metrics help spot whether the team’s time is being used efficiently. It’s a valuable indicator of workload balance.
How to calculate it: To find the agent utilization rate percentage, count the total hours an agent spends on support tasks, divide by their total available work hours, and multiply by 100.
7. Customer satisfaction ratings
Type of metric: Customer impact
Customer satisfaction is a very important customer service KPI and IT service desk metric. Organizations can measure satisfaction with customer satisfaction (CSAT) surveys following ticket resolution. Once customers complete them, you can see successful interactions or drill into tickets where the customer wasn’t happy.
There’s also the Net Promoter Score (NPS), which asks customers to rate you on a scale of 1 to 10 based on how likely they are to recommend your company to friends or family. By tracking these customer support performance metrics, you have a clear understanding of how each interaction impacts satisfaction and trust.
Why it matters: Customer satisfaction ratings are key to finding out how well your help desk meets customer expectations. They play a fundamental part in identifying opportunities to improve overall customer experience.
How to calculate it: To find the CSAT percentage, divide the number of satisfied or very satisfied responses by the total number of survey responses, then multiply by 100.
8. Customer Effort Score
Type of metric: Customer impact
Customer Effort Score (CES) is acustomer service metric measuring the effort a customer must expend to resolve an issue, get an answer, or complete a task. To determine your CES rating, send a survey asking customers to rate the ease of their support interaction on a scale of “very easy” to “very difficult.” Then, calculate the average number based on all of your responses.
You can even include a comment section so customers can describe what made their experience a challenge or a breeze. Sending out CES surveys for various customer interactions helps companies identify what needs simplifying. For example, CES surveys might reveal how hard it is for buyers to return an item or troubleshoot a software issue.
Why it matters: CES metrics show how easy it is for customers to get help or complete tasks. The lower the effort, the higher the satisfaction and loyalty.
How to calculate it: To calculate the average CES,add up all CES ratings and divide by the total number of survey responses.
9. Transfer rate
Type of metric: Customer impact
Transfer rate is the percentage of tickets that agents transfer to another team member or department. A high transfer rate could indicate that employees or customers are reaching the wrong first-touch agent. In this case, the help desk’s internal routing system may be the problem.
Intelligent automation can help route employees or customers to the right agent based on their request type, language, or area of expertise. For example, a chatbot can collect key customer information upfront and then route the conversation to the right person to help.
Why it matters: Transfer rate metrics show how effectively tickets are routed to the right agent or department. They identify gaps in routing rules or categorization issues.
How to calculate it: To calculate the transfer rate,divide the number of tickets transferred to another agent or department by the total number of tickets handled in a given period, then multiply by 100.
10. Net Promoter Score
Type of metric: Customer impact
“On a scale of 0–10, how likely are you to recommend our company based on your recent support experience?” The question we often get after interacting with customer support is used to measure satisfaction and loyalty. According to their answers, respondents are grouped as Promoters (9–10), Passives (7–8), or Detractors (0–6).
Net Promoter Score (NPS) measures how satisfied customers are with the overall CX based on their willingness to recommend your business to others.
Why it matters: High NPS ratings reflect your company’s efforts to build trust and long-term customer retention. Plus, few marketing tactics are as efficient as satisfied customers recommending your business.
How to calculate it: To find the NPS, subtract the percentage of detractors from the percentage of promoters.
11. Service Level Agreement (SLA) compliance
Type of metric: Customer impact
A Service Level Agreement (SLA) is a contract between a service provider and a customer that determines the level of service the provider promises to deliver. Usually, an SLA includes performance metrics, response and resolution timelines, and the consequences of not meeting expectations.
So, SLA compliance in help and service desk metrics measures how well a support team meets the response and resolution targets agreed in the SLA. It indicates the support team’s reliability and efficiency.
Why it matters: SLA compliance determines whether your team is responding to and resolving tickets on time, in accordance with the agreement. It also helps identify bottlenecks when delays are happening.
How to calculate it: To calculate the SLA compliance percentage, divide the number of tickets resolved within SLA and the total number of tickets (all within a specific period). Then, multiply the number by 100.
12. First response time
Type of Metric: Agent Performance
First response time, or first reply time, is the time between creating a support request and the first documented action a service desk agent takes. The longer this is, the more you jeopardize customer or employee satisfaction. Most people want, at least, an acknowledgment that someone has started looking into the issue in a reasonable amount of time after submitting their service request.
Requester wait time is the cumulative time that a support request is unresolved while an agent is working on the issue. During a ticket spike, managing expectations for your help desk and service desk customers is a good idea. People are usually understanding if you’re transparent about extended wait times instead of hiding it.
Why it matters: First response time metrics matter because initial quick responses reassure that the issue is being addressed, building trust. It’s important to keep an eye on your average first response time to identify areas of improvement.
How to calculate it: To calculate the average first response time, first subtract the time the request was made from the time the first response was given for each ticket. Then, add up the duration of all first response times for a given period and divide by the total number of tickets.
13. First contact resolution
Type of metric: Agent performance
First contact resolution (FCR) refers to tickets that are resolved after the first contact with a support agent or service desk staff. Your goal should be to increase your number of first contact resolutions because this means customers get an answer quickly and painlessly, improving your CX.
At the same time, resolving tickets on the first try can improve your efficiency because fewer agents have to touch the ticket. This makes it a good help and service desk metric to target for improvement.
Free guide: Top customer service metrics to measure
From customer satisfaction to resolution time, these are the key customer service metrics that measure performance and drive revenue.
Why it matters: When customers have their problem solved in one go, they know they can count on your support, which builds trust. First contact resolution is also essential to minimize follow-ups and lower overall ticket volume.
How to calculate it: To calculate FCR percentage, divide the number of tickets resolved during the first interaction by the total number of tickets handled, then multiply by 100.
14. Average Handle Time
Type of metric: Agent performance
Average handle time (AHT) is an important KPI for your help and service desks. It shows how efficiently agents solve issues from start to finish. This is a key service and help desk metric because it tells you how long an employee or customer must wait for their issue to be resolved—an important aspect of the overall customer experience (CX).
Why it matters: Tracking average handle time helps the team to collectively keep it low. Low AHT levels improve productivity and reduce wait times, contributing to faster support.
How to calculate it: To calculate AHT,add the total time spent handling all resolved tickets (including talk, chat, and follow-up time) and divide by the total number of resolved tickets.
15. Escalation rate
Type of metric: Agent performance
Escalation rate metrics display the percentage of tickets escalated to higher-tier support teams. When a company’s escalation rate is high, it means either the agents handling the initial support need more training, or triage and self-service need improvement.
Why it matters: Escalation rate metrics are important to understand whether agents are handling initial support effectively. The lower the escalation rate, the better trained your front-line support team is.
How to calculate it: To calculate the escalation rate percentage, divide the number of tickets escalated by the total number of tickets received, then multiply by 100.
16. Cost per ticket
Type of metric: Financial impact
As the name suggests, cost per ticket is the average cost of resolving a support request. All operational expenses like salaries, software, and hardware are included in the math.
Why it matters: Tracking cost per ticket provides insights into your support team’s efficiency and financial performance. It’s an important metric to understand how effectively financial resources are being used and if they need to be reallocated.
How to calculate it: To calculate cost per ticket, add up all help desk operating costs for a given period and divide by the total number of resolved tickets during that same period.
17. ROI
Type of metric: Financial impact
Short for return on investment, the ROI measures the financial return from help desk operations compared to the cost of running them. It’s used to assess if the financial investments in tools, staff, and other improvements are generating the expected return in customer retention, efficiency gains, or reduced costs.
Why it matters: Tracking ROI is essential to determine the success of an investment in your help desk. If your company invests in software like Zendesk analytics to increase productivity, reduce ticket resolution times, and improve customer satisfaction, the ROI will reflect that positive impact. So, it’s an essential metric to quantify the outcomes of an investment.
How to calculate it: To calculate ROI percentage, first subtract total help desk costs from the total financial benefits gained (savings, retained customers, or revenue influenced). Then, divide by the total costs and multiply by 100.
Best practices for improving your help and service desk metrics
Follow these help desk best practices to improve your help and service desk metrics and KPIs.
Deploy AI agents to deliver faster responses
Implementing AI agents can help lower response and resolution times, reduce the ticket backlog, and improve overall agent performance. Using generative AI, AI-powered agents can answer customer questions using natural human language. They’re also “always on,” offering 24/7 support, reducing wait times, and enabling a help or service desk team to answer more tickets simultaneously.
Additionally, AI agents can recommend help center articles so customers and employees are empowered to help themselves, freeing up human agents to focus on higher-stake tasks. Keep in mind to track important AI agents metrics, such as automation rate, containment rate, and deflection rate.
Send satisfaction surveys to collect employee feedback
To improve your IT or HR help desk, collect employee feedback on how it currently operates. Employee input can help internal teams understand where problems are happening and how to resolve them.
To collect employee feedback, set up triggers in your support software to automatically send a survey to team members when their tickets close. Ask survey questions about the level of satisfaction with their service desk experience and how much effort they had to put in.
Offer a knowledge base or self-service portal
A great way to improve satisfaction scores while lowering ticket backlog is to offer a knowledge base or self-service portal. Help desk software should always come with an option for a knowledge base.
Often, people are just looking for a quick solution to a simple issue. Rather than submitting another ticket, customers and employees can search for and resolve issues independently using a knowledge base. This reduces the strain on the help desk team so they can solve more complicated issues that need one-on-one support.
Use automation, apps, and integrations to help your team work smarter, not harder
Save your team time by ensuring they can access apps, systems, and integrations for change management, asset management, team collaboration, and more—all from one central place. Connecting popular apps like Slack and Zoom also reduces system switching.
Another way you can help your team work smarter is by creating request forms that direct certain types of requests to the appropriate team and close tickets after a specified time frame.
6 benefits of tracking help desk metrics
Tracking help desk metrics uncovers valuable insights that help empower support teams and strengthen customer relationships. These tracking efforts result in better service.
Beyond identifying what’s working and what needs improvement, consistently tracking help desk metrics results in many benefits.
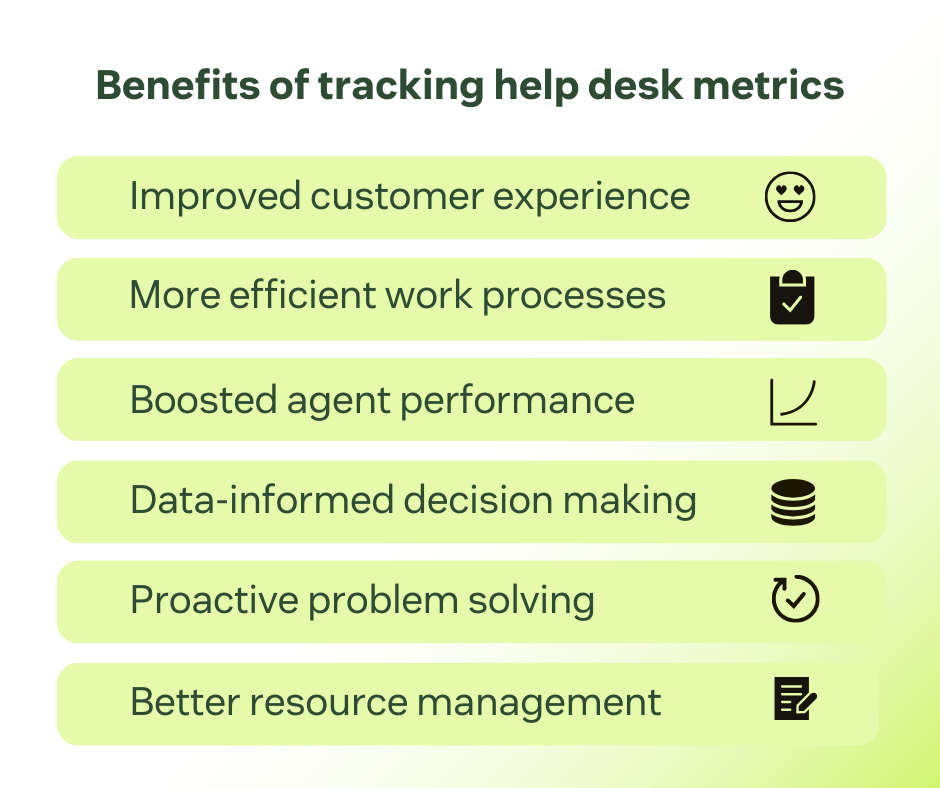
1. Improved customer experience
Help desk and service desk metrics give you a clear view of how customers and employees experience your support. Data like FRT, AHT, and FCR is essential to reduce wait times and improve resolution, smoothing the support experience and boosting satisfaction.
2. More efficient work processes
Analyzing help and service desk metrics is a great way to identify workflow bottlenecks. Watching data points like ticket volume and resolution time helps you identify what slows down processes. Then, you can take action on improving them.
3. Boosted agent performance
With help desk metrics like agent utilization rate and escalation rate, managers can identify agents’ strengths and areas for improvement. Having this information allows them to provide feedback and targeted training, as well as recognize top performers. All this contributes to a prepared, motivated, and more productive support team.
4. Data-informed decision making
Important decisions involving staffing, financial investments, and business strategies can’t be based on guesswork alone. Help desk metrics and KPIs provide actionable information based on reliable numbers. Having such data-driven insights allows you to make smarter decisions.
5. Proactive problem solving
Proactive actions prevent problems from happening. For instance, the more customers and employees can rely on a thorough knowledge base, the less they’ll reach out to support teams with an issue. Tracking help desk metrics like ticket volume and SLA compliance allows you to spot patterns early.
6. Better resource management
Help desk metrics help companies with workload distribution, staffing, and tools investment. Valuable insights that result from these metrics help support teams identify high-demand periods to staff accordingly and invest in useful automation tools. This results in a more efficient use and allocation of resources.
Getting started on help desk metrics and KPIs: A brief step-by-step guide
Tracking help desk metrics is only effective when there’s a clear plan behind it. The following steps outline how to set goals, select the right metrics, and build a foundation for consistent, data-driven performance management.
Step 1: Choose your goals
Set clear goals you want to achieve. It can be saving money or making better use of it, enhancing productivity, or boosting customer satisfaction. Then, determine which ones are the biggest priorities for the moment. Having clear objectives is essential to know which metrics you should focus on tracking.
Step 2: Decide which metrics to track
With your goals clearly defined, it’s time to decide which metrics give you the insights you need to achieve your goals. For example, if your current priority is to allocate resources more efficiently, then you should keep track of ticket volume, agent utilization rate, cost per ticket, and ROI.
Step 3: Establish benchmarks for each metric
Benchmarks make it easier to evaluate whether your team is improving or falling behind expectations. Set clear benchmarks for each help desk metric to measure progress effectively. Your reference points can be industry standards, historical data, or internal performance trends.
Step 4: Bring employees up to speed and set clear expectations
Everyone in your team needs to be aware of how their work contributes to the bigger picture. When agents see how their daily actions affect measurable outcomes, accountability and motivation naturally increase.
Share your help desk goals and KPIs to set clear expectations from the team and bring them up to speed. Provide training on how to interpret metrics, and explain how they influence rewards, performance reviews, and development opportunities.
Step 5: Build your reporting dashboard
Having a dashboard with real-time information is important to keep track of where the team is excelling and where it needs to improve. A robust help desk tool should allow you to easily create your own help desk reporting metrics dashboard. The dashboard should help you visualize trends, compare time periods, and share insights across departments.
Step 6: Ask for feedback from customers and employees
Metrics give you direction, but feedback gives you results. Customer surveys, agent feedback sessions, and post-ticket follow-ups can uncover insights that numbers alone might miss. So, constantly encourage customers and employees to share their experiences with your support process to refine your help desk strategy.
Frequently asked questions
Take your help desk experience to the next level
Now that you understand these important help and service desk metrics, it’s time to take the next step. With a unified service solution like Zendesk, tracking metrics is only the beginning.
With service desk software, you can provide fast resolutions, boost agent productivity, and empower your customers and employees with helpful self-service options.